Vision Safety
Coverage Geometry
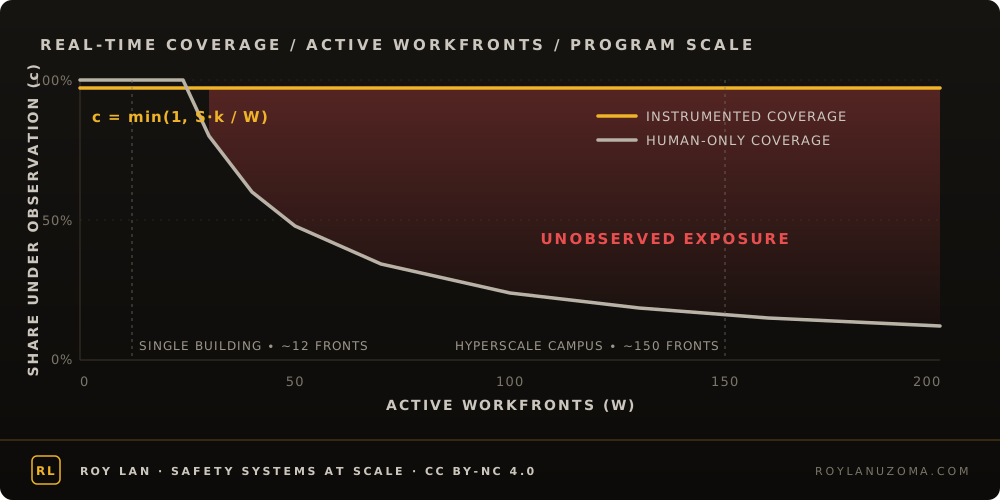
Real-time safety coverage is headcount divided by workfronts, and detection follows coverage.
On a large program the share of active work under real-time human observation is capped by the number of safety officers, how many fronts each can watch, and how many fronts run in parallel. Once coverage is small, the probability that a transient unsafe act is seen collapses with it, whatever the diligence of the people on site. Instrumented observation loosens the cap because it stops drawing on the shared human budget.
c = min(1, S·k / W)P = 1 − e−c·m
- S
- trained safety officers on the program
- k
- workfronts one officer can meaningfully watch at a time
- W
- workfronts running in parallel
- c
- share of active work under real-time observation
- m
- watch intensity on a covered front; P is the chance a transient unsafe act is seen
Builds on: Koopman's random-search detection law (exponential detection).
Exposure Models
Latent Exposure Debt
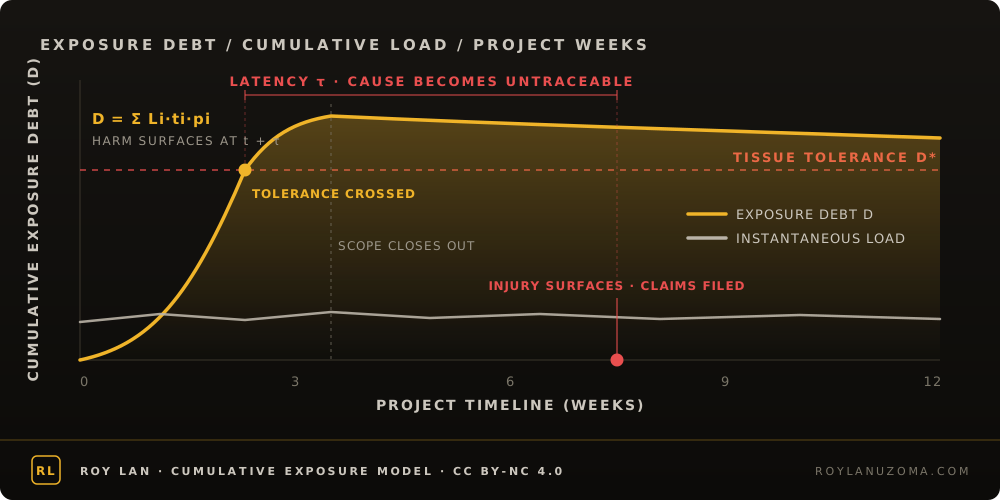
Cumulative load, duration, and posture add up like fatigue damage, and the injury surfaces weeks after the work that built it.
Slow injuries do not come from one bad lift. They come from many sub-critical cycles that each leave a mark, until the sum crosses tissue tolerance. Summing load, duration, and a posture multiplier across an activity gives a deliberately simple index of that debt. Two features carry the argument: the debt is an integral, so a real-time camera sees only the instantaneous term; and the harm presents with a latency, after the crew has moved on and the cause is gone from the workfront.
D = Σi Li · ti · piharm surfaces at t + τ
- L
- load imposed by a task cycle
- t
- duration the load is sustained
- p
- posture multiplier from observational scoring such as REBA or RULA
- D
- accumulated exposure debt across the activity
- τ
- latency between the exposure and the clinical presentation
Builds on: Palmgren-Miner cumulative damage; Kumar's cumulative-load theory of musculoskeletal injury.
Exposure Models
ECERI: Elevated Construction Ergonomic Risk Index
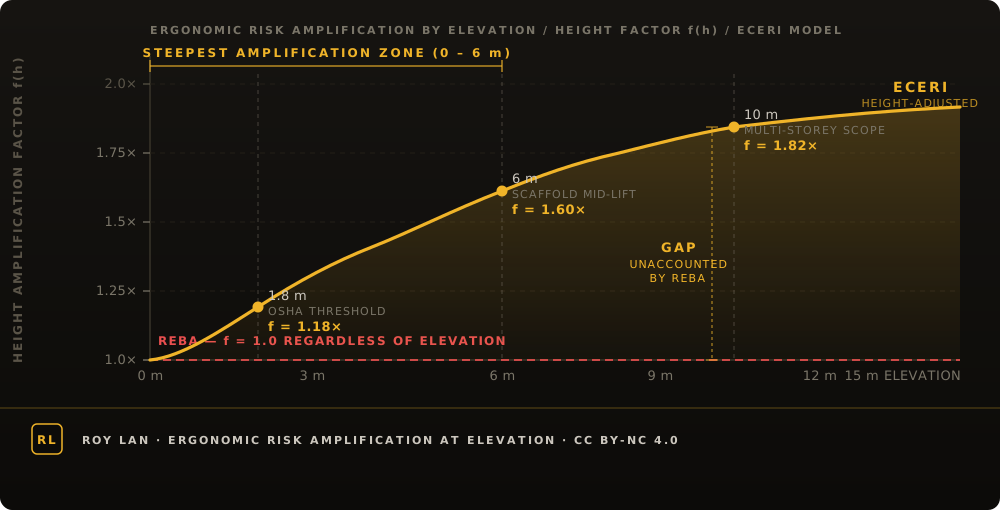
REBA scores the posture; ECERI puts back the height, the harness, and the platform that make the same posture more dangerous at elevation.
Standard ergonomic scoring treats a task at 8 meters the same as the same task on the ground. ECERI contextualizes REBA for height-exposed work by amplifying the base score with the constraints that elevation adds: restricted footing, fall-arrest equipment that limits movement and adds load, reach over guardrails, and the fatigue of sustained tension. It is the lab's published index for elevated work and the seed of the C-ERA framework.
Builds on: REBA (Hignett and McAtamney) extended with elevation-specific amplification factors; published in the Journal of Safety Research.
Exposure Models
Heat Planning Pressure
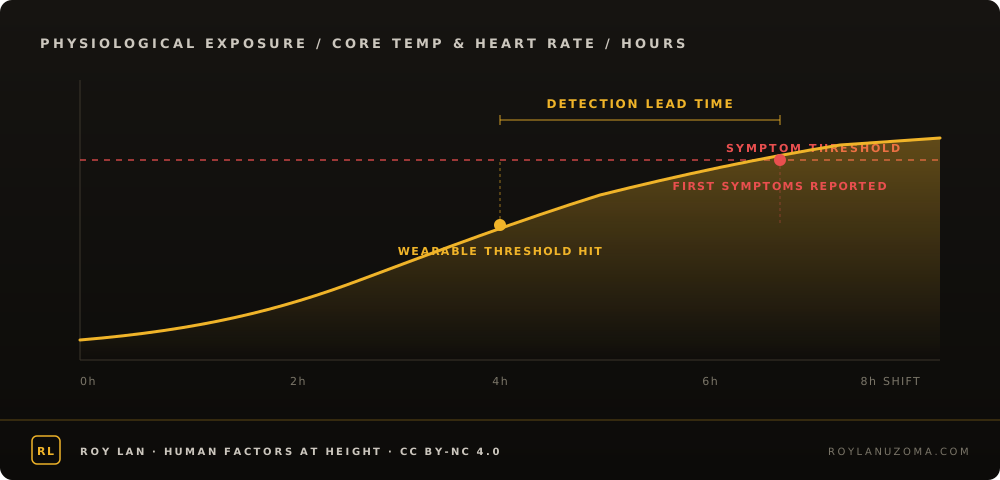
A screening index for hot-weather work packages, with a safety floor so a dangerous day can never read low.
At the work-packaging stage the question is not the medical state of a worker but how much control a package needs before release. The planning pressure score sums heat load, heat-amplified task load, duration, PPE burden, and acclimatization, then applies a floor: at a heat index of 103 F or above, the NWS 'Danger' threshold, the score cannot fall below 80. It prioritizes controls before the shift, and it never replaces WBGT monitoring on the day.
score = min(100, heat load + task load · f(heat) + duration + PPE + acclimatization)floor: score ≥ 80 when heat index ≥ 103 F
- heat load
- grows with heat index, radiant exposure, and PPE
- f(heat)
- amplification of metabolic load by ambient heat
- duration
- exposure hours beyond a four-hour base
Builds on: ACGIH TLV for heat stress, NIOSH criteria, OSHA Heat NEP, NWS heat index categories.
Decision Verification
The Keystone Loop
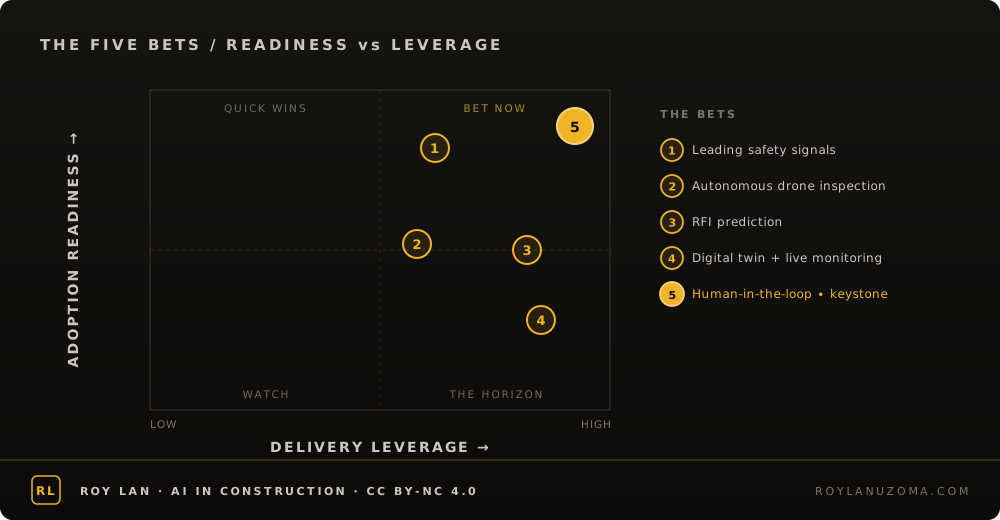
The human-in-the-loop is the binding constraint on every AI bet in construction: who receives the signal, what decision it supports, and how the result feeds back.
An AI safety alert nobody acts on is worthless and a prediction nobody trusts changes nothing. The leverage of any model comes from the operating loop around it, run by a field-fluent engineer close to project engineering, safety, quality, and controls rather than a data-science hire bolted onto the org chart. The capability bets mature on their own; the keystone bet matures only when a program deliberately puts someone in charge of the loop.
Builds on: Adoption data from Dodge Data and Analytics; the lab's own field experience with alerts that were not acted on.
Decision Verification
The Four-Layer Twin
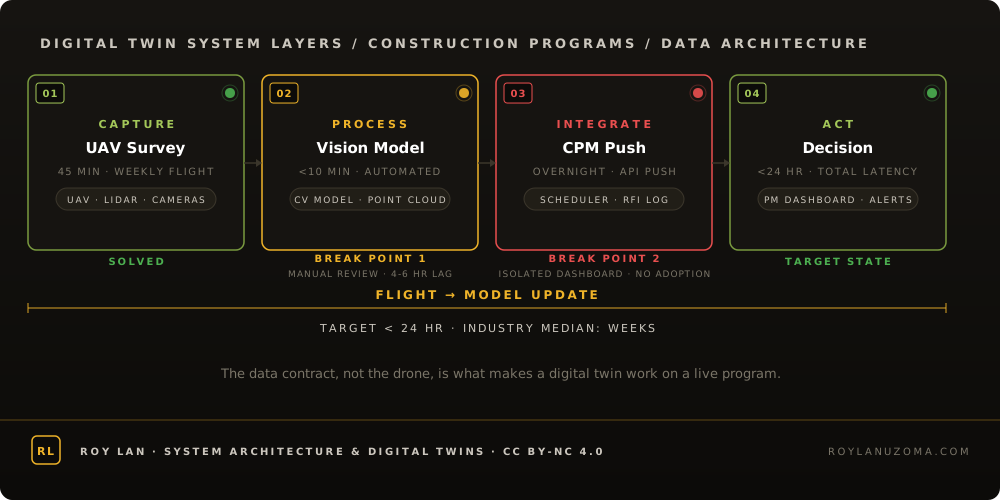
A live digital twin has four layers, capture, process, integrate, act, and it fails at a different layer than the one the industry invests in.
Capture is largely solved. Processing is where most deployments break first, because raw imagery does not become schedule-ready progress data on its own. Integration is where they break second, because output that lives on a separate dashboard is not consulted under schedule pressure. Action is where the twin either delivers or documents: a deviation flagged 72 hours before the affected activity reaches the critical path is a decision; the same flag 72 hours after is a post-mortem note.
- latency
- time from capture to a decision-ready output; the diagnostic treats 24 hours as the working target
Builds on: Field deployments of reality-capture and progress-model comparison.
Decision Verification
Routing Is the Bottleneck
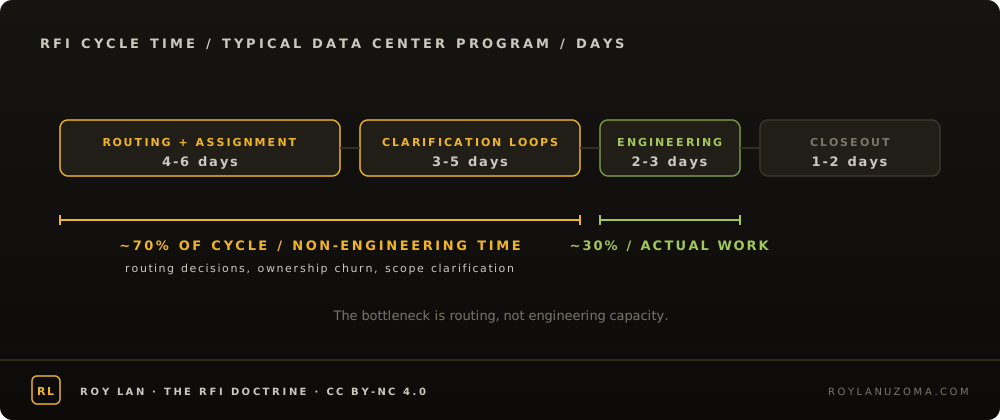
RFI volume is a symptom; schedule pain comes from how long each RFI sits unresolved, which is a routing problem.
A program that generates 3,000 RFIs and resolves them in a median of four days is outperforming one with 1,500 RFIs and a twelve-day median, because the first has trade contractors moving and the second has crews working around frozen scopes. The Routing Index scores routing discipline from 0 to 100, and the simulator shows the schedule days recovered when handling tightens, weighted by whether the RFIs are field-blocking, commissioning-critical, or long-lead.
- Routing Index
- 0 to 100 score of routing discipline
- median resolution
- days an RFI sits before a usable answer
Builds on: Navigant Construction Forum RFI study; project-controls practice on data-center programs.
Delivery and Education
The Near-Term Readiness Window
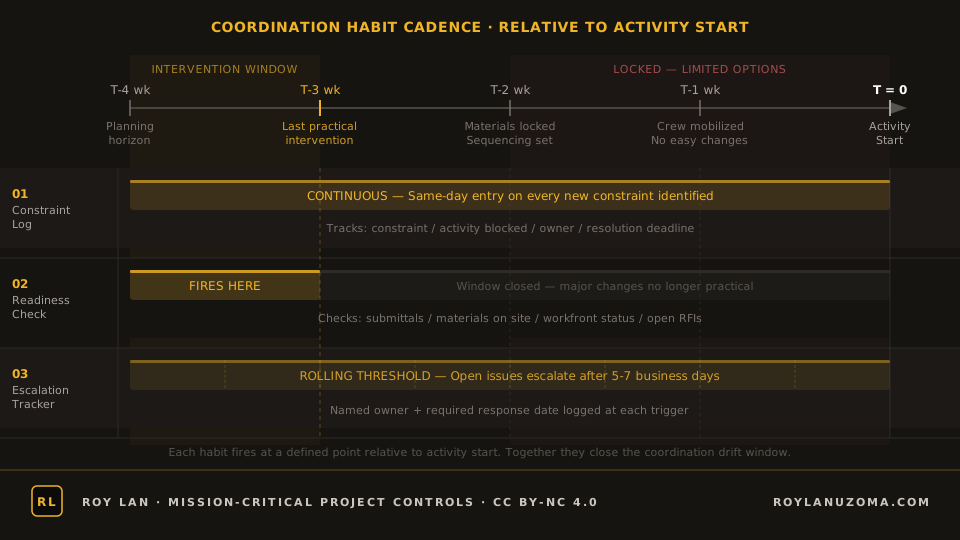
Three to four weeks before an activity starts is the last practical intervention point; after that the options are delay or improvisation.
By two weeks out, long-lead materials are locked, scaffold is going up, and trade sequencing is committed. By one week out the crew is mobilized. The readiness checklist asks the same four questions of every activity approaching its start: submittals approved and issued for construction, materials on site or dated inside the window, the preceding activity on track to turn over the workfront, and no open RFI that could change the method once execution starts. The commissioning index applies the same logic to turnover, scoring the bottleneck system rather than the average.
- T-4 to T-3 weeks
- last cheap intervention point
- bottleneck
- the least-ready system sets the commissioning date, not the mean
Builds on: Last-planner style lookahead practice; commissioning readiness on mission-critical programs.
Decision VerificationIN DEVELOPMENT
Risk Certificate Decay
A risk certificate issued against a plan loses validity as the process graph changes, so it should carry an expiry rather than stand until someone questions it.
Risk on a construction program is usually certified once, at the plan stage, and then treated as current until an incident says otherwise. The graph the certificate was issued against changes every shift: RFIs alter methods, resequencing moves interfaces, crews turn over. This framework gives each certificate a validity that decays with the change events touching its scope, weighted by how much each kind of event can alter the certified condition. When validity falls below a threshold the certificate expires and re-verification is triggered, before an incident rather than after one.
V(t) = V0 · e−Σj wj · nj(t)re-verify when V(t) < Vmin
- V0
- validity at issue; 1 for a freshly verified certificate
- nj(t)
- change events of type j that have touched the certified scope since issue: RFIs, resequencing, crew turnover, design revisions
- wj
- how much one event of type j can alter the certified condition
- Vmin
- the validity below which re-verification is required
Builds on: Hazard-rate and reliability decay models; change-impact analysis from software verification.
Decision VerificationIN DEVELOPMENT
Verification Allocation Rule
The next inspection hour should go where uncertainty times consequence is highest, not where the schedule happens to put it.
Verification effort on most programs is spread evenly: every activity gets its inspection and every hold point its sign-off, whether or not anything about it is uncertain. This rule ranks candidate activities by the expected risk reduction per hour of verification, which rises with how uncertain the current risk estimate is, how severe the consequence would be, and how much one verification act would actually narrow the estimate. Effort then concentrates where it can change a decision, and for any hour spent the rule can say why it went there.
si = Ui · Ci · gi / hiallocate hours in descending si
- Ui
- uncertainty in the current risk estimate for activity i
- Ci
- consequence if activity i fails
- gi
- expected narrowing of Ui from one verification act
- hi
- hours that verification act costs
Builds on: Value-of-information analysis (Raiffa and Schlaifer); risk-based inspection planning (API RP 580); adaptive sampling.
Vision SafetyIN DEVELOPMENT
Confidence Routing Threshold
The point at which a vision model should hand a case to a person is a cost-weighted threshold on calibrated confidence, not a number picked in a demo.
A detection model that acts on every prediction also acts on its wrong ones, and one that routes everything to a person has gained nothing from automation. If the model's confidence is calibrated, the hand-over point can be set from costs: what a missed hazard costs, what a false alarm costs in stopped work and crew trust, and what one human review costs in time. The framework sets that threshold explicitly, counts how many cases cross it, and treats a rising routing rate as an early sign that the model has drifted.
route to a person when min(p · cmiss, (1 − p) · cFA) > cH
- p
- calibrated probability that the detected hazard is real
- cmiss
- cost of missing a real hazard
- cFA
- cost of a false alarm: stopped work, lost trust
- cH
- cost of one human review
Builds on: Bayes decision theory with a reject option (Chow's rule); calibration of vision-based ergonomic assessment (Author's Research, ISARC 2026).